Waste management in Melbourne CBD
View the complete project on GithubThis article suggests the best pathway to help Melbourne CBD improve its waste management and sustainability by exploring Street Degraves Recycling Center's waste capacities and operations.
1. Research question: Can Degraves Street Recycling Facility meet the demand of waste disposal?
Melbourne CBD is a high traffic area with 40000 residents, numerous shops and cafeterias which produce a large amount of waste. To confront this, Degraves Street Recycling Facility was established in 2013 in the hope to simultaneously decrease waste sent to landfill while increasing the rate of recycling. We will analyze if the amount of waste recycled is high enough and suggest the best pathway to help Melbourne CBD improve its waste management and sustainability.
2. Data processing and analysis
a. Data summary
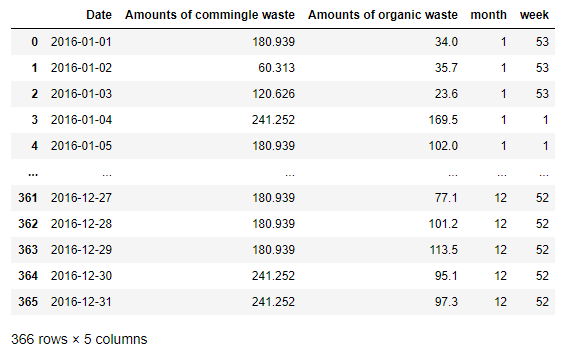
For this project, 5 datasets will be used to evaluate the performance of the recycling center. The first 4 datasets contain essential information about Degraves Street Recycling Facility - records of the amounts of 4 collected waste categories (organic, cardboard, commingled and polystyrene waste) throughout 2016 while the last one provides waste collection services of Melbourne from 2011 to 2016.
As 4 datasets at Degraves recycling centre are collected in different time periods, their sizes vary greatly, in which the first 2 datasets are collected daily (366 rows) while the last 2 are gathered weekly. Despite such a difference in size and variables, for the purpose of this project, only 2 columns are required from each dataset for further analysis, which are the date and the net collection columns.
Although the number of features and rows in each dataset are different, they all share a common column - date column, on which the corresponding net weight column of each dataset is joint. which will be further illustrated in data wrangling.
b. Data wrangling
In this project, the majority of work involved with data cleansing is dealing with missing values. In particular, there are up to 23 NAN values (since September no observation is recorded) in polystyrene.csv, 7 missing values in organic.csv, 1 missing value in commingle.csv. Therefore, missing values are imputed with the mean value, rather than backward fill or forward fill to ensure the stability of the dataset
In order to merge datasets using the date column, data binning is necessary to scale all time stamps to the same period. Hence, for further data analysis and time series plots, frequency resampling to weekly/monthly is applied to showcase waste trends and recycling center’s strengths and weaknesses . In addition, the data of Melbourne’s collected waste is also carried out on a monthly basis; therefore, timestamps will need to be scaled monthly for the first 4 datasets again to evaluate the performance of this center versus the entire city of Melbourne.
a. Aggregating and merging daily datasets to create commingle_organic dataset
2 datasets that are merged are commingle.csv and organic.csv. After being merged, 2 columns months and week will be appended at the end to perform data aggregation (grouping by month) to merge with cardboard.csv and polystyrene dataset to create the center's recycling rate with regard to City of Melbourne
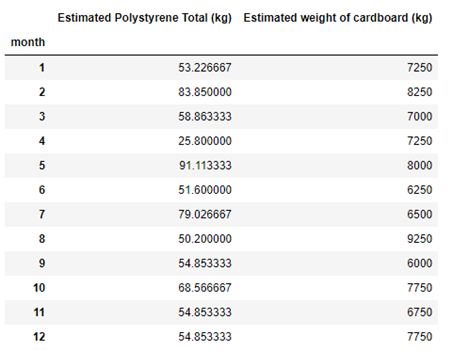
b. Aggregating and Merging weekly dataset to create board_poly dataset
2 datasets that are merged are cardboard.csv and polystyrene.csv. The same process (merging data aggregation - groupby().sum() ) is applied to merge with the dataset in part a to create part c. This dataset is used to create Figure 1
c. Combining the city of Melbourne dataset in 2016 with datasets of Degraves Center to show the center's recycling rate with regard to City of Melbourne
Remarks:
c. Machine learning
1. Building a machine learning model for predicting the recycling rate in a given year
As an illustration, we are going to predict the center’s recycling rate for commingled waste in 2017. In order to achieve this, there are 2 tasks to be completed:
- Task 1: predict the total amount of commingled waste in the City of Melbourne in 2017 from a given time
- Task 2: predict the recycling rate based on the previously calculated total amount of commingled waste
Task 1: Input (beginning of the month - 1/10/2017) -- Output: Total amount of commingled waste in Melbourne
Preprocessing: Create a data pipeline (feature selection, standard scaling, imputation) to perform data transformation on datasets.
Training: A sketch of data points reveals that the data is not exactly linear; and to test the validity of this assumption, I have trained 3 different algorithms: LinearRegression, Support Vector Regression, and RandomForestRegressor (an ensemble learning algorithm) with default parameters.
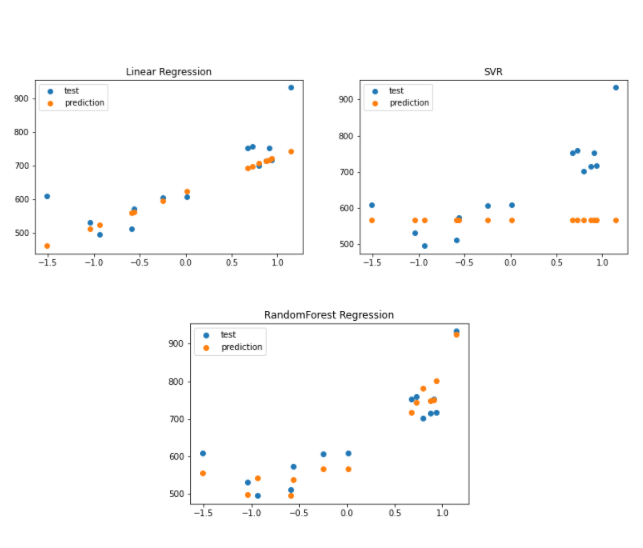
Evaluation: By using negative mean squared error as an evaluation metric, RandomForestRegressor is the most suitable algorithm for this model
Tuning hyperparameters: By setting a range of values on 2 hyperparameters and put the model under cross-validation, it was found that the optimal values for this model is: max_depth = 6 and n_estimators = 15
Limitations: Because there is only a small amount of data (roughly 132 instances), there might be a chance of overfitting. Besides, it does not scale very well on the far future due to the small dataset.
Task 2: predict the recycling rate based on the previously calculated total amount of commingled waste
- Assumptions: There are only 12 instances for this recycling center in 2016; therefore, to avoid overfitting, we are going to use a simple model: Linear Regression, without splitting into train and test set
- Limitations: The amount of data is too small for training and testing, which makes it difficult to extrapolate in the far future (2050). Therefore, we are going to predict the recycling rate in October 2017, (reasonably close enough to 2016). If more data is collected for this center monthly in a larger interval of time, it can predict more precisely in a further future.
- Result: The predicted recycling rate is 0.7045%, which suggests that the center’s contribution to recycling commingled waste is likely to decrease in the future.
3. Analysis/Key result
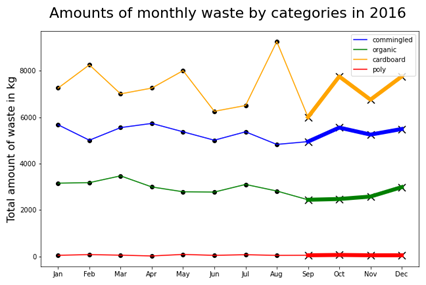
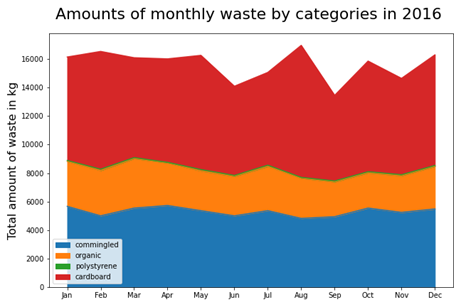
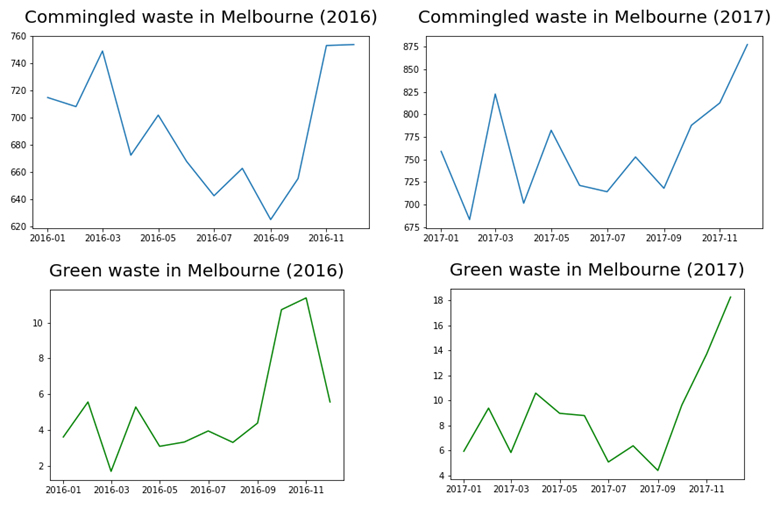
From the graph, there is an increase in the amount of waste in all 4 categories, which is highly supported by green waste and commingled waste (Figure 2-5). The significant growth in the amount of waste circulating in the city from September onward is expected annually since it is the time of the year where Melbourne reaches its seasonal tourism. As the city gets more populated it will be more polluted. All waste materials show a significant uptrend in mass from September to the remainder of the year. The general trend of all waste materials was similar with respect to month of the year except for the steep incline in mass of cardboard waste recycled in the month of August.
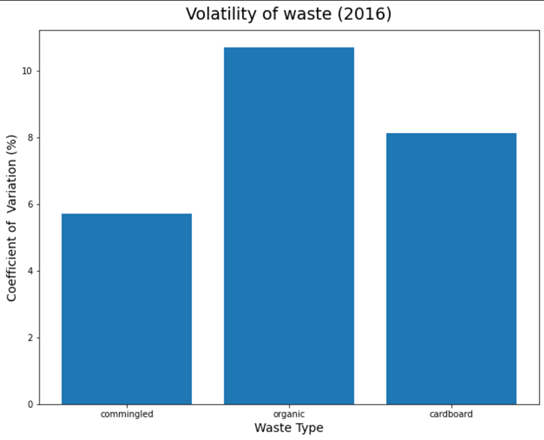
Overall, organic, cardboard and commingled waste have low variation with their coefficient of variation around 10%, 8% and 6% respectively. In addition, organic waste with the highest variation helps confirm our belief about special times like holidays raising food waste significantly, not just a fluctuation in resident taste.
Recycling rate: To truly understand the impact that Degraves Street Recycling Center has on Melbourne, we first have to first walk through the “position” of the city in relation to recycling measures. The given situation as well as main reason why DSRC was launched in the first place was mostly due to the poorly managed waste bin and also no recycling methods were recorded amongst businesses in the precinct operate area of DSRC.
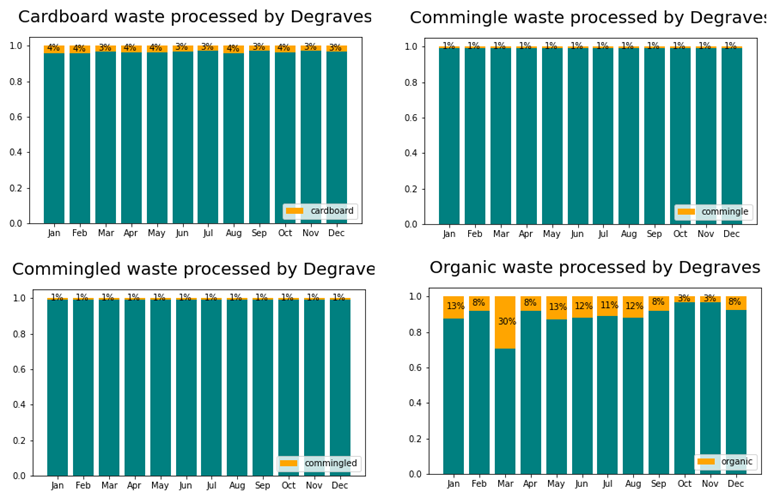
The produced bar charts that may seem somewhat blizzard at first actually has a lot to do with the location of DSRC. Since the facilities are located in the CBD, it is no surprise that there are large amounts of food- related waste compared to other parts of the city. As a result DSRC thrives in the amount of waste it is able to collect in this specific waste category. However, the reason why commingled waste is so low is because commingled waste comprises a mixture of waste including metal. Therefore, recycling centers in industrial zones can potentially create a large amount of commingled waste, which reduces the contribution of DSRC in this waste category.
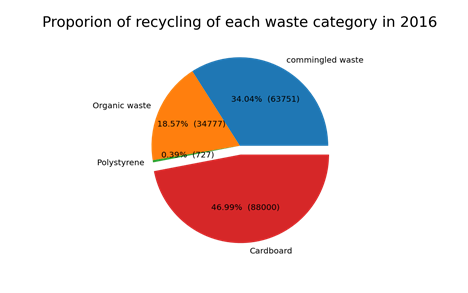
In summary cardboard waste was responsible for 46.99% of the total waste in Degraves recycling centre, followed by commingled waste at 34.04%, organic waste at 18.57% and polystyrene at 0.39% in the year of 2016. The data gives us an insight on the relatively high percentage of cardboard waste being recycled at the Degraves recycling centre and low percentage of polystyrene waste being recycled.
Besides, the amount of waste processed by DSRC is enormous, taking up to approximately a third of the city of Melbourne’s organic waste in March, which is because there are many restaurants, cafes and bars in the Central Business District releasing a huge amount of green waste. Therefore, more public trash bins should be installed publicly (on the streets and in apartments) to facilitate the center’s organic recycling process.
By contrast, the amount of commingled waste is so low because commingled waste consists of metals and glass, which is highly detrimental to human’s health when processed. Therefore, an assumption of the new plan in the future is that all of these harmful wastes are transferred to other facilities in the suburb of Melbourne to minimize the environmental and health risks, which confirms the result of the machine learning model that there is a drop in the amount of commingled waste recycled by DSRC next year.
5. Limitations
Challenges
- A large number of missing values especially in polystyrene.csv, which might lead to error in analysis
- An assumption is that green waste accounts for 14.286% organic waste; however this number is approximation and might be different in each area (WASTE AND RECYCLING IN MELBOURNE)
- The amount of data for DSRC is collected only in 2016, which is very small, making it difficult for further analysis in other years and prediction in the far future (machine learning)
- If more data is collected for this center in other years (2015,2017,...), waste trends can be better analyzed and the machine learning model can generalize better and predict in a more distant future with higher accuracy.