Titanic exploratory data analysis
View the complete project on GithubThis notebook aims at 2 goals: analyzing the titanic dataset to find out the underlying assumptions and predicting whether a person would have survived or not given their information
Steps
Data wrangling
Data summary
A summary of the dataset shows that the dataset is mostly clean, except the 2 features which are Age and Cabin
Data cleaning
The feature cabin has so many missing values so it won't add up too much value to our analysis. In addition, as the ticket is unique to each person, which might depend on other values, so it is removed too.
The PassengerId feature should also be removed as it is basically the index
However, the age feature should be imputed with the mean value by using the Simple Imputer later
Data analysis
Data Visualization

 More about the conclusion can be found in the Notebook
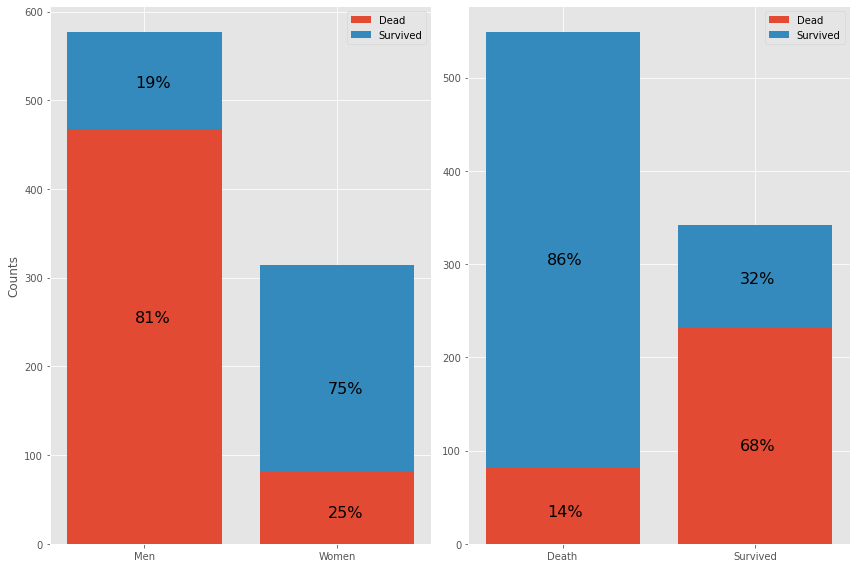
Group analysis
Almost nothing useful. Potentially interesting:
- 1st class have higher survival rate (First label)
- 3rd class was travelling in larger families (Third label)
- 2nd and 3rd class fare was very close larger families had more children (low age passengers) in them
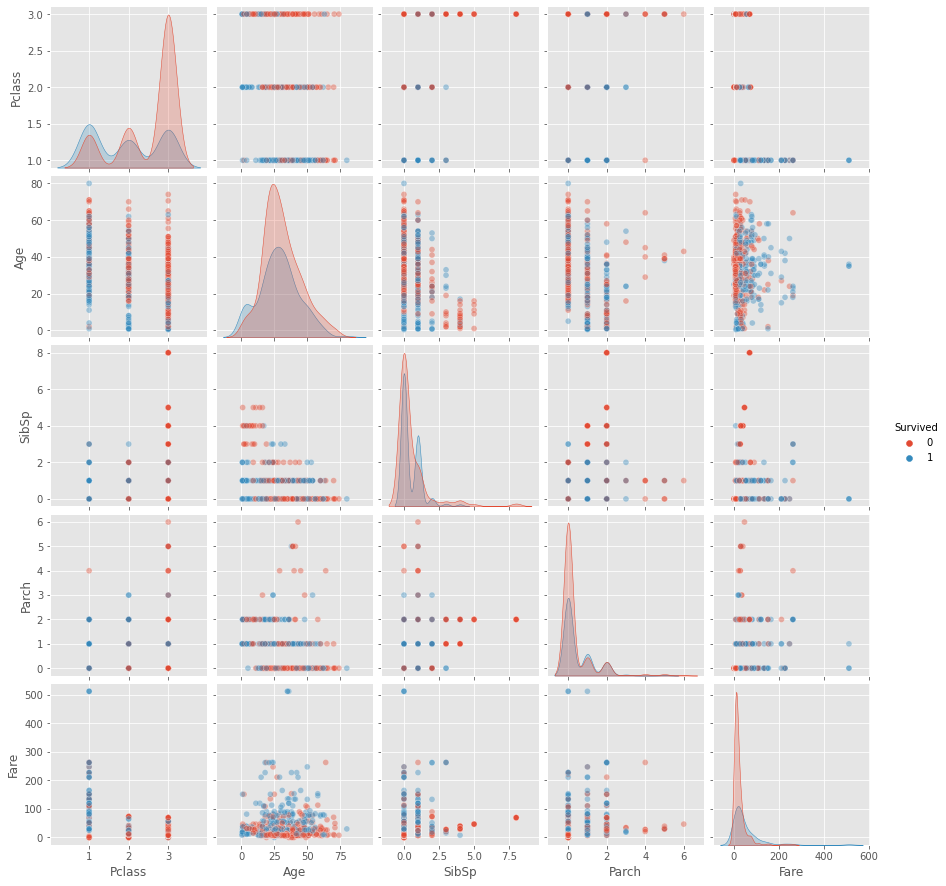
In general for all classes:
EDA results
Lets sum up our discoveries concerning importance of given features:
Machine learning
In this case, 3 algorithms, including logistic classifier, support vector machine, random forest are applied to find the best model for prediction of survival. In addition, a neural network is also used as a reference to prove whether it is always best to use deep learning or not.
In general, random forest outperforms the other 2 algorithms with an accuracy of 97.98% on the training set and 100% on the test set (More information about the accuracy of other algorithms can be found here
However, neural networks are unlikely to work well in this situation, it soonly becomes overfit although the hyperparameters have been fine-tuned and the learning rate is quite small.